|
Download Data (XLS File) |
|
|||||
|
|||||
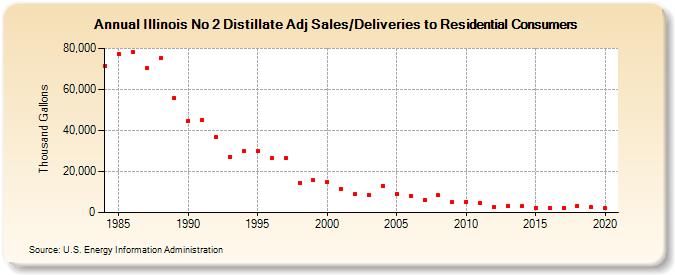
| Illinois No 2 Distillate Adj Sales/Deliveries to Residential Consumers (Thousand Gallons) | |||||
| Decade | Year-0 | Year-1 | Year-2 | Year-3 | Year-4 | Year-5 | Year-6 | Year-7 | Year-8 | Year-9 |
|---|---|---|---|---|---|---|---|---|---|---|
| 1980's | 71,532 | 77,422 | 78,215 | 70,255 | 75,294 | 55,923 | ||||
| 1990's | 44,855 | 45,287 | 36,849 | 27,282 | 29,840 | 29,896 | 26,350 | 26,650 | 14,590 | 15,719 |
| 2000's | 14,986 | 11,651 | 8,838 | 8,502 | 13,123 | 9,211 | 8,012 | 6,177 | 8,398 | 4,936 |
| 2010's | 5,324 | 4,582 | 2,682 | 3,152 | 2,993 | 2,338 | 2,382 | 2,431 | 3,377 | 2,628 |
| 2020's | 2,167 |
| - = No Data Reported; -- = Not Applicable; NA = Not Available; W = Withheld to avoid disclosure of individual company data. |
| Release Date: 2/9/2022 |
| Next Release Date: Suspended |