|
Download Data (XLS File) |
|
|||||
|
|||||
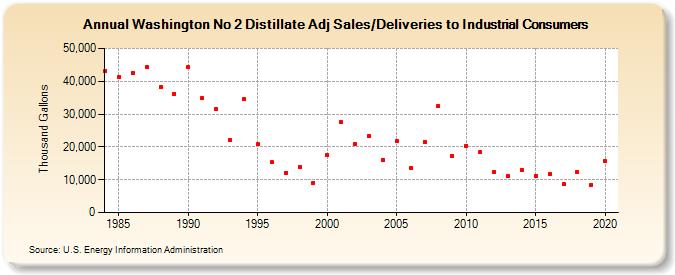
| Washington No 2 Distillate Adj Sales/Deliveries to Industrial Consumers (Thousand Gallons) | |||||
| Decade | Year-0 | Year-1 | Year-2 | Year-3 | Year-4 | Year-5 | Year-6 | Year-7 | Year-8 | Year-9 |
|---|---|---|---|---|---|---|---|---|---|---|
| 1980's | 43,128 | 41,148 | 42,361 | 44,345 | 38,197 | 36,190 | ||||
| 1990's | 44,219 | 34,871 | 31,428 | 22,061 | 34,531 | 20,803 | 15,314 | 12,154 | 13,894 | 9,095 |
| 2000's | 17,477 | 27,461 | 20,825 | 23,370 | 16,128 | 21,765 | 13,699 | 21,634 | 32,393 | 17,221 |
| 2010's | 20,397 | 18,333 | 12,359 | 11,067 | 13,107 | 11,217 | 11,828 | 8,557 | 12,308 | 8,494 |
| 2020's | 15,586 |
| - = No Data Reported; -- = Not Applicable; NA = Not Available; W = Withheld to avoid disclosure of individual company data. |
| Release Date: 2/9/2022 |
| Next Release Date: Suspended |