|
Download Data (XLS File) |
|
|||||
|
|||||
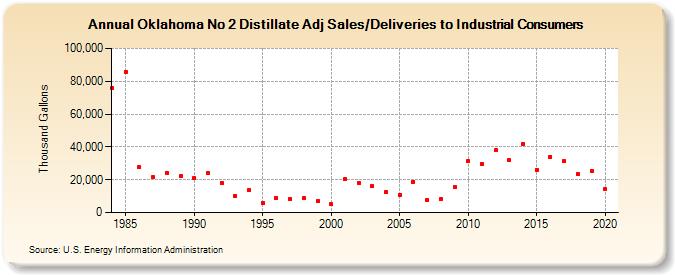
| Oklahoma No 2 Distillate Adj Sales/Deliveries to Industrial Consumers (Thousand Gallons) | |||||
| Decade | Year-0 | Year-1 | Year-2 | Year-3 | Year-4 | Year-5 | Year-6 | Year-7 | Year-8 | Year-9 |
|---|---|---|---|---|---|---|---|---|---|---|
| 1980's | 76,033 | 85,923 | 27,517 | 21,568 | 24,239 | 21,989 | ||||
| 1990's | 20,797 | 24,335 | 18,292 | 10,088 | 13,650 | 5,931 | 8,899 | 8,377 | 8,627 | 6,998 |
| 2000's | 4,993 | 20,188 | 18,116 | 15,899 | 12,585 | 10,870 | 18,686 | 7,615 | 8,178 | 15,684 |
| 2010's | 31,140 | 29,801 | 38,064 | 31,990 | 41,776 | 26,193 | 33,973 | 31,344 | 23,428 | 25,426 |
| 2020's | 14,193 |
| - = No Data Reported; -- = Not Applicable; NA = Not Available; W = Withheld to avoid disclosure of individual company data. |
| Release Date: 2/9/2022 |
| Next Release Date: Suspended |