|
Download Data (XLS File) |
|
|||||
|
|||||
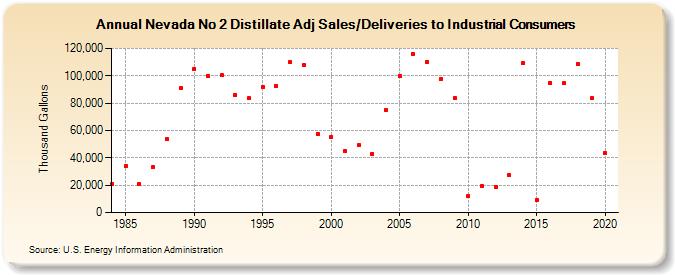
| Nevada No 2 Distillate Adj Sales/Deliveries to Industrial Consumers (Thousand Gallons) | |||||
| Decade | Year-0 | Year-1 | Year-2 | Year-3 | Year-4 | Year-5 | Year-6 | Year-7 | Year-8 | Year-9 |
|---|---|---|---|---|---|---|---|---|---|---|
| 1980's | 20,573 | 34,034 | 20,579 | 32,950 | 53,549 | 90,723 | ||||
| 1990's | 105,204 | 99,828 | 100,237 | 85,814 | 83,462 | 91,839 | 92,375 | 109,787 | 107,568 | 57,430 |
| 2000's | 55,276 | 44,930 | 49,102 | 42,746 | 75,220 | 100,155 | 115,977 | 110,077 | 97,398 | 83,626 |
| 2010's | 11,751 | 19,489 | 18,914 | 27,249 | 109,046 | 9,345 | 94,870 | 94,489 | 108,845 | 83,508 |
| 2020's | 43,385 |
| - = No Data Reported; -- = Not Applicable; NA = Not Available; W = Withheld to avoid disclosure of individual company data. |
| Release Date: 2/9/2022 |
| Next Release Date: Suspended |