|
Download Data (XLS File) |
|
|||||
|
|||||
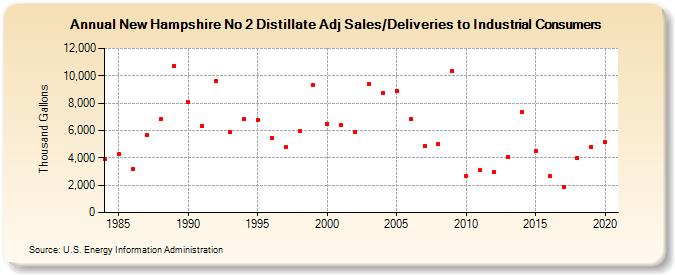
| New Hampshire No 2 Distillate Adj Sales/Deliveries to Industrial Consumers (Thousand Gallons) | |||||
| Decade | Year-0 | Year-1 | Year-2 | Year-3 | Year-4 | Year-5 | Year-6 | Year-7 | Year-8 | Year-9 |
|---|---|---|---|---|---|---|---|---|---|---|
| 1980's | 3,884 | 4,251 | 3,159 | 5,704 | 6,834 | 10,739 | ||||
| 1990's | 8,061 | 6,354 | 9,628 | 5,886 | 6,868 | 6,800 | 5,471 | 4,764 | 5,965 | 9,357 |
| 2000's | 6,474 | 6,379 | 5,867 | 9,409 | 8,704 | 8,903 | 6,834 | 4,848 | 5,043 | 10,337 |
| 2010's | 2,685 | 3,092 | 2,959 | 4,055 | 7,352 | 4,468 | 2,641 | 1,842 | 3,958 | 4,794 |
| 2020's | 5,165 |
| - = No Data Reported; -- = Not Applicable; NA = Not Available; W = Withheld to avoid disclosure of individual company data. |
| Release Date: 2/9/2022 |
| Next Release Date: Suspended |