|
Download Data (XLS File) |
|
|||||
|
|||||
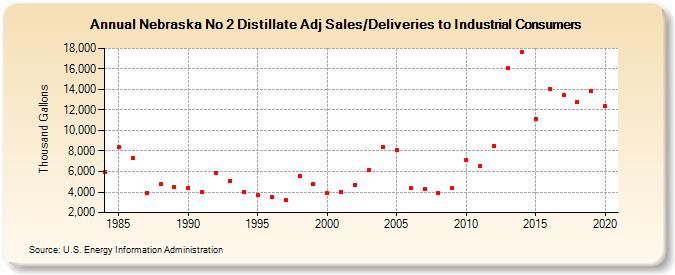
| Nebraska No 2 Distillate Adj Sales/Deliveries to Industrial Consumers (Thousand Gallons) | |||||
| Decade | Year-0 | Year-1 | Year-2 | Year-3 | Year-4 | Year-5 | Year-6 | Year-7 | Year-8 | Year-9 |
|---|---|---|---|---|---|---|---|---|---|---|
| 1980's | 5,940 | 8,349 | 7,338 | 3,877 | 4,758 | 4,520 | ||||
| 1990's | 4,411 | 4,046 | 5,830 | 5,099 | 4,013 | 3,672 | 3,561 | 3,271 | 5,603 | 4,781 |
| 2000's | 3,875 | 4,020 | 4,731 | 6,148 | 8,436 | 8,112 | 4,369 | 4,281 | 3,927 | 4,400 |
| 2010's | 7,130 | 6,511 | 8,524 | 16,076 | 17,614 | 11,145 | 14,065 | 13,416 | 12,772 | 13,812 |
| 2020's | 12,376 |
| - = No Data Reported; -- = Not Applicable; NA = Not Available; W = Withheld to avoid disclosure of individual company data. |
| Release Date: 2/9/2022 |
| Next Release Date: Suspended |