|
Download Data (XLS File) |
|
|||||
|
|||||
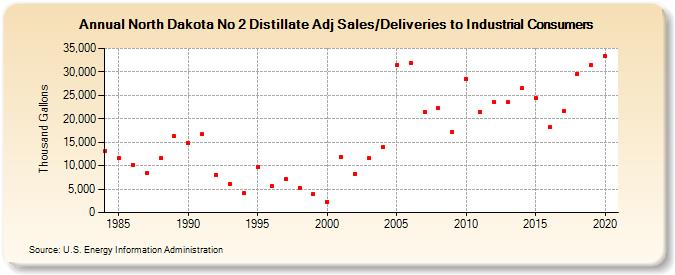
| North Dakota No 2 Distillate Adj Sales/Deliveries to Industrial Consumers (Thousand Gallons) | |||||
| Decade | Year-0 | Year-1 | Year-2 | Year-3 | Year-4 | Year-5 | Year-6 | Year-7 | Year-8 | Year-9 |
|---|---|---|---|---|---|---|---|---|---|---|
| 1980's | 13,078 | 11,624 | 10,228 | 8,410 | 11,572 | 16,223 | ||||
| 1990's | 14,782 | 16,684 | 8,101 | 6,127 | 4,116 | 9,788 | 5,690 | 7,074 | 5,321 | 3,933 |
| 2000's | 2,309 | 11,938 | 8,260 | 11,531 | 13,887 | 31,440 | 31,907 | 21,499 | 22,208 | 17,240 |
| 2010's | 28,504 | 21,462 | 23,642 | 23,503 | 26,489 | 24,472 | 18,146 | 21,667 | 29,543 | 31,457 |
| 2020's | 33,367 |
| - = No Data Reported; -- = Not Applicable; NA = Not Available; W = Withheld to avoid disclosure of individual company data. |
| Release Date: 2/9/2022 |
| Next Release Date: Suspended |