|
Download Data (XLS File) |
|
|||||
|
|||||
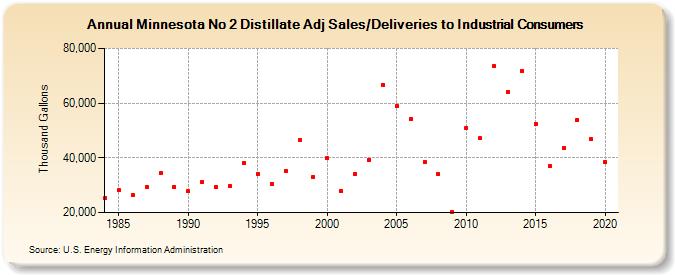
| Minnesota No 2 Distillate Adj Sales/Deliveries to Industrial Consumers (Thousand Gallons) | |||||
| Decade | Year-0 | Year-1 | Year-2 | Year-3 | Year-4 | Year-5 | Year-6 | Year-7 | Year-8 | Year-9 |
|---|---|---|---|---|---|---|---|---|---|---|
| 1980's | 25,263 | 28,066 | 26,426 | 29,444 | 34,358 | 29,376 | ||||
| 1990's | 27,763 | 31,188 | 29,230 | 29,663 | 38,250 | 34,246 | 30,474 | 35,346 | 46,412 | 33,151 |
| 2000's | 39,824 | 27,827 | 34,258 | 39,384 | 66,744 | 59,012 | 54,262 | 38,524 | 34,094 | 20,217 |
| 2010's | 51,039 | 47,114 | 73,606 | 64,042 | 71,847 | 52,500 | 36,929 | 43,629 | 53,861 | 46,728 |
| 2020's | 38,606 |
| - = No Data Reported; -- = Not Applicable; NA = Not Available; W = Withheld to avoid disclosure of individual company data. |
| Release Date: 2/9/2022 |
| Next Release Date: Suspended |