|
Download Data (XLS File) |
|
|||||
|
|||||
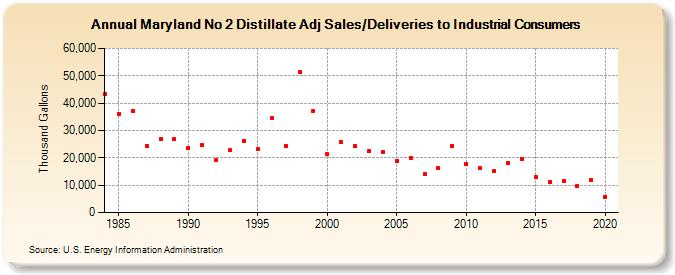
| Maryland No 2 Distillate Adj Sales/Deliveries to Industrial Consumers (Thousand Gallons) | |||||
| Decade | Year-0 | Year-1 | Year-2 | Year-3 | Year-4 | Year-5 | Year-6 | Year-7 | Year-8 | Year-9 |
|---|---|---|---|---|---|---|---|---|---|---|
| 1980's | 43,278 | 36,187 | 37,166 | 24,265 | 26,888 | 26,790 | ||||
| 1990's | 23,705 | 24,716 | 19,038 | 22,744 | 26,318 | 23,411 | 34,611 | 24,352 | 51,493 | 37,284 |
| 2000's | 21,335 | 25,930 | 24,184 | 22,348 | 22,228 | 19,015 | 19,863 | 14,016 | 16,153 | 24,339 |
| 2010's | 17,687 | 16,129 | 15,124 | 18,122 | 19,747 | 12,969 | 11,330 | 11,380 | 9,869 | 11,854 |
| 2020's | 5,780 |
| - = No Data Reported; -- = Not Applicable; NA = Not Available; W = Withheld to avoid disclosure of individual company data. |
| Release Date: 2/9/2022 |
| Next Release Date: Suspended |