|
Download Data (XLS File) |
|
|||||
|
|||||
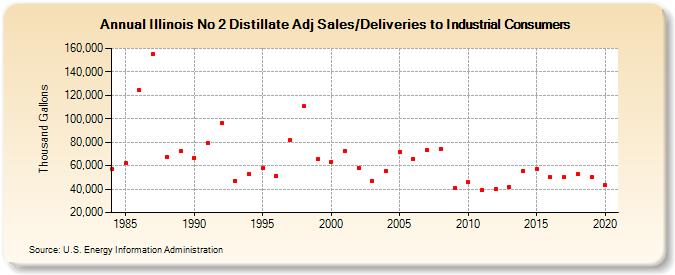
| Illinois No 2 Distillate Adj Sales/Deliveries to Industrial Consumers (Thousand Gallons) | |||||
| Decade | Year-0 | Year-1 | Year-2 | Year-3 | Year-4 | Year-5 | Year-6 | Year-7 | Year-8 | Year-9 |
|---|---|---|---|---|---|---|---|---|---|---|
| 1980's | 56,992 | 62,197 | 124,434 | 154,908 | 67,123 | 72,147 | ||||
| 1990's | 66,788 | 79,201 | 96,533 | 47,266 | 53,288 | 57,626 | 51,281 | 81,621 | 110,622 | 65,879 |
| 2000's | 63,465 | 72,523 | 58,137 | 47,072 | 55,477 | 71,898 | 65,917 | 73,604 | 74,217 | 40,920 |
| 2010's | 45,852 | 39,396 | 40,161 | 41,765 | 55,540 | 57,509 | 50,220 | 50,486 | 52,753 | 50,044 |
| 2020's | 43,148 |
| - = No Data Reported; -- = Not Applicable; NA = Not Available; W = Withheld to avoid disclosure of individual company data. |
| Release Date: 2/9/2022 |
| Next Release Date: Suspended |