|
Download Data (XLS File) |
|
|||||
|
|||||
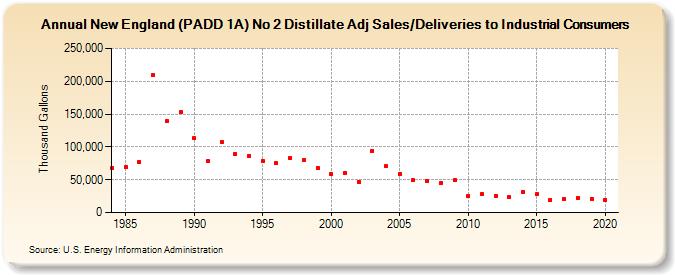
| New England (PADD 1A) No 2 Distillate Adj Sales/Deliveries to Industrial Consumers (Thousand Gallons) | |||||
| Decade | Year-0 | Year-1 | Year-2 | Year-3 | Year-4 | Year-5 | Year-6 | Year-7 | Year-8 | Year-9 |
|---|---|---|---|---|---|---|---|---|---|---|
| 1980's | 67,441 | 68,628 | 77,459 | 209,193 | 139,013 | 152,630 | ||||
| 1990's | 112,982 | 77,895 | 107,839 | 89,469 | 86,273 | 78,760 | 75,132 | 83,816 | 80,310 | 68,317 |
| 2000's | 58,650 | 59,678 | 46,341 | 94,342 | 70,244 | 59,143 | 48,878 | 48,491 | 44,389 | 49,034 |
| 2010's | 25,412 | 28,239 | 25,527 | 23,638 | 31,365 | 27,603 | 19,606 | 20,456 | 22,584 | 21,155 |
| 2020's | 19,518 |
| - = No Data Reported; -- = Not Applicable; NA = Not Available; W = Withheld to avoid disclosure of individual company data. |
| Release Date: 2/9/2022 |
| Next Release Date: Suspended |