|
Download Data (XLS File) |
|
|||||
|
|||||
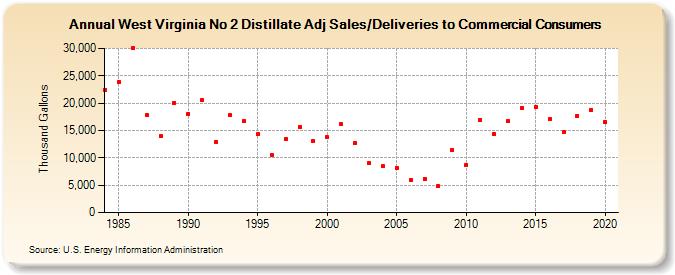
| West Virginia No 2 Distillate Adj Sales/Deliveries to Commercial Consumers (Thousand Gallons) | |||||
| Decade | Year-0 | Year-1 | Year-2 | Year-3 | Year-4 | Year-5 | Year-6 | Year-7 | Year-8 | Year-9 |
|---|---|---|---|---|---|---|---|---|---|---|
| 1980's | 22,450 | 23,879 | 29,994 | 17,837 | 14,021 | 20,065 | ||||
| 1990's | 18,072 | 20,529 | 12,963 | 17,799 | 16,747 | 14,291 | 10,586 | 13,448 | 15,620 | 13,025 |
| 2000's | 13,757 | 16,104 | 12,749 | 8,973 | 8,462 | 8,225 | 6,001 | 6,191 | 4,828 | 11,482 |
| 2010's | 8,742 | 16,929 | 14,351 | 16,725 | 19,137 | 19,266 | 17,073 | 14,666 | 17,725 | 18,812 |
| 2020's | 16,601 |
| - = No Data Reported; -- = Not Applicable; NA = Not Available; W = Withheld to avoid disclosure of individual company data. |
| Release Date: 2/9/2022 |
| Next Release Date: Suspended |