|
Download Data (XLS File) |
|
|||||
|
|||||
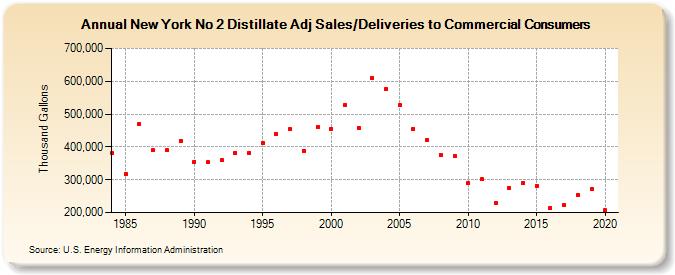
| New York No 2 Distillate Adj Sales/Deliveries to Commercial Consumers (Thousand Gallons) | |||||
| Decade | Year-0 | Year-1 | Year-2 | Year-3 | Year-4 | Year-5 | Year-6 | Year-7 | Year-8 | Year-9 |
|---|---|---|---|---|---|---|---|---|---|---|
| 1980's | 380,934 | 317,381 | 471,171 | 390,451 | 389,032 | 418,951 | ||||
| 1990's | 355,246 | 352,984 | 359,356 | 381,913 | 382,546 | 412,273 | 439,876 | 453,074 | 388,287 | 461,891 |
| 2000's | 455,894 | 528,309 | 458,826 | 609,267 | 576,466 | 526,314 | 454,533 | 421,064 | 376,076 | 371,977 |
| 2010's | 290,559 | 301,226 | 228,424 | 276,053 | 289,315 | 282,358 | 214,144 | 221,769 | 253,685 | 272,713 |
| 2020's | 206,761 |
| - = No Data Reported; -- = Not Applicable; NA = Not Available; W = Withheld to avoid disclosure of individual company data. |
| Release Date: 2/9/2022 |
| Next Release Date: Suspended |