|
Download Data (XLS File) |
|
|||||
|
|||||
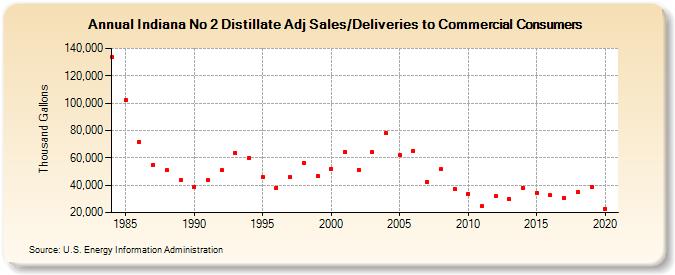
| Indiana No 2 Distillate Adj Sales/Deliveries to Commercial Consumers (Thousand Gallons) | |||||
| Decade | Year-0 | Year-1 | Year-2 | Year-3 | Year-4 | Year-5 | Year-6 | Year-7 | Year-8 | Year-9 |
|---|---|---|---|---|---|---|---|---|---|---|
| 1980's | 133,604 | 102,359 | 71,559 | 54,882 | 50,886 | 43,579 | ||||
| 1990's | 38,836 | 43,549 | 50,861 | 63,899 | 59,906 | 45,821 | 38,313 | 45,822 | 56,284 | 46,884 |
| 2000's | 52,091 | 64,532 | 51,395 | 64,051 | 78,266 | 61,925 | 65,304 | 42,495 | 51,478 | 37,306 |
| 2010's | 33,762 | 24,463 | 31,900 | 29,968 | 38,162 | 34,500 | 32,474 | 30,556 | 35,272 | 38,995 |
| 2020's | 22,800 |
| - = No Data Reported; -- = Not Applicable; NA = Not Available; W = Withheld to avoid disclosure of individual company data. |
| Release Date: 2/9/2022 |
| Next Release Date: Suspended |