|
Download Data (XLS File) |
|
|||||
|
|||||
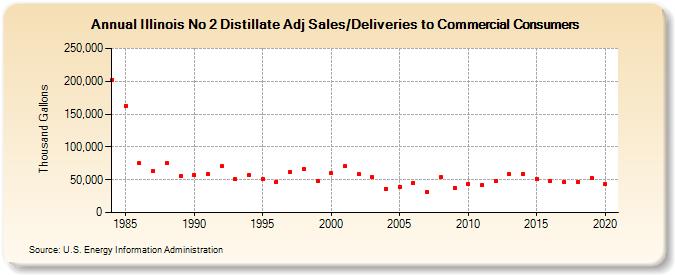
| Illinois No 2 Distillate Adj Sales/Deliveries to Commercial Consumers (Thousand Gallons) | |||||
| Decade | Year-0 | Year-1 | Year-2 | Year-3 | Year-4 | Year-5 | Year-6 | Year-7 | Year-8 | Year-9 |
|---|---|---|---|---|---|---|---|---|---|---|
| 1980's | 201,851 | 163,008 | 74,991 | 63,470 | 75,025 | 55,255 | ||||
| 1990's | 57,067 | 58,033 | 70,356 | 51,429 | 56,902 | 50,734 | 47,006 | 62,014 | 66,826 | 48,603 |
| 2000's | 59,489 | 70,508 | 58,377 | 53,809 | 36,399 | 39,644 | 45,106 | 32,033 | 53,701 | 38,113 |
| 2010's | 43,714 | 41,891 | 48,320 | 58,289 | 59,471 | 51,704 | 48,428 | 46,685 | 46,241 | 52,978 |
| 2020's | 43,481 |
| - = No Data Reported; -- = Not Applicable; NA = Not Available; W = Withheld to avoid disclosure of individual company data. |
| Release Date: 2/9/2022 |
| Next Release Date: Suspended |