|
Download Data (XLS File) |
|
|||||
|
|||||
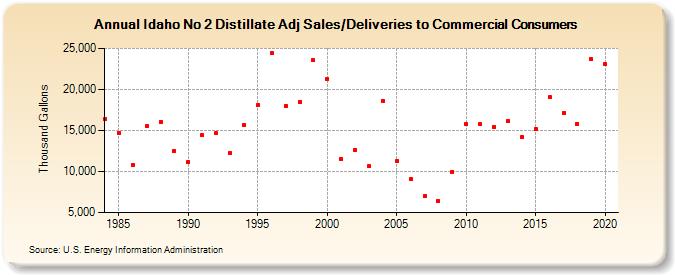
| Idaho No 2 Distillate Adj Sales/Deliveries to Commercial Consumers (Thousand Gallons) | |||||
| Decade | Year-0 | Year-1 | Year-2 | Year-3 | Year-4 | Year-5 | Year-6 | Year-7 | Year-8 | Year-9 |
|---|---|---|---|---|---|---|---|---|---|---|
| 1980's | 16,370 | 14,729 | 10,812 | 15,506 | 16,075 | 12,491 | ||||
| 1990's | 11,167 | 14,390 | 14,636 | 12,284 | 15,668 | 18,104 | 24,456 | 18,037 | 18,492 | 23,545 |
| 2000's | 21,312 | 11,564 | 12,669 | 10,632 | 18,605 | 11,228 | 9,105 | 6,966 | 6,408 | 9,954 |
| 2010's | 15,762 | 15,752 | 15,466 | 16,174 | 14,155 | 15,161 | 19,064 | 17,169 | 15,846 | 23,671 |
| 2020's | 23,105 |
| - = No Data Reported; -- = Not Applicable; NA = Not Available; W = Withheld to avoid disclosure of individual company data. |
| Release Date: 2/9/2022 |
| Next Release Date: Suspended |