|
Download Data (XLS File) |
|
|||||
|
|||||
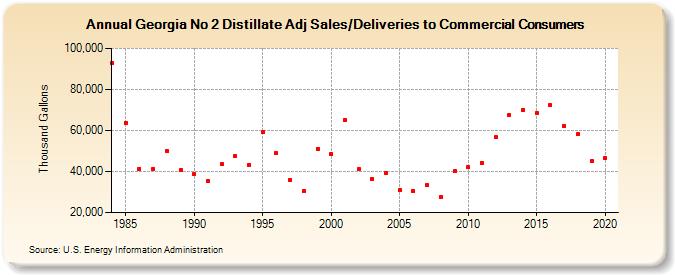
| Georgia No 2 Distillate Adj Sales/Deliveries to Commercial Consumers (Thousand Gallons) | |||||
| Decade | Year-0 | Year-1 | Year-2 | Year-3 | Year-4 | Year-5 | Year-6 | Year-7 | Year-8 | Year-9 |
|---|---|---|---|---|---|---|---|---|---|---|
| 1980's | 92,670 | 63,837 | 41,431 | 41,323 | 50,030 | 40,644 | ||||
| 1990's | 38,767 | 35,401 | 43,505 | 47,436 | 43,320 | 59,040 | 49,009 | 36,002 | 30,477 | 51,120 |
| 2000's | 48,768 | 65,218 | 41,194 | 36,551 | 39,384 | 30,873 | 30,519 | 33,302 | 27,533 | 40,119 |
| 2010's | 42,127 | 44,319 | 56,578 | 67,591 | 69,908 | 68,553 | 72,233 | 62,353 | 58,063 | 45,216 |
| 2020's | 46,631 |
| - = No Data Reported; -- = Not Applicable; NA = Not Available; W = Withheld to avoid disclosure of individual company data. |
| Release Date: 2/9/2022 |
| Next Release Date: Suspended |