|
Download Data (XLS File) |
|
|||||
|
|||||
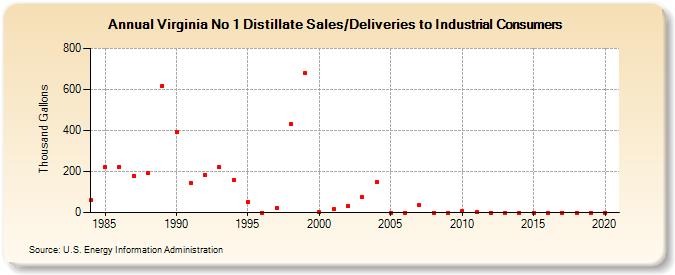
| Virginia No 1 Distillate Sales/Deliveries to Industrial Consumers (Thousand Gallons) | |||||
| Decade | Year-0 | Year-1 | Year-2 | Year-3 | Year-4 | Year-5 | Year-6 | Year-7 | Year-8 | Year-9 |
|---|---|---|---|---|---|---|---|---|---|---|
| 1980's | 59 | 221 | 224 | 180 | 191 | 619 | ||||
| 1990's | 394 | 146 | 182 | 221 | 161 | 53 | 0 | 24 | 431 | 680 |
| 2000's | 1 | 16 | 32 | 74 | 149 | 0 | 0 | 35 | 0 | 0 |
| 2010's | 9 | 4 | 0 | 0 | 0 | 0 | 0 | 0 | 0 | 0 |
| 2020's | 0 |
| - = No Data Reported; -- = Not Applicable; NA = Not Available; W = Withheld to avoid disclosure of individual company data. |
| Release Date: 2/9/2022 |
| Next Release Date: Suspended |