|
Download Data (XLS File) |
|
|||||
|
|||||
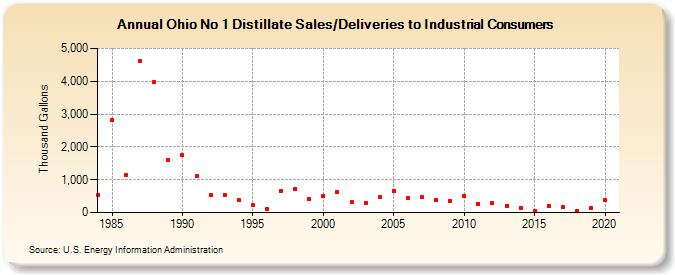
| Ohio No 1 Distillate Sales/Deliveries to Industrial Consumers (Thousand Gallons) | |||||
| Decade | Year-0 | Year-1 | Year-2 | Year-3 | Year-4 | Year-5 | Year-6 | Year-7 | Year-8 | Year-9 |
|---|---|---|---|---|---|---|---|---|---|---|
| 1980's | 536 | 2,805 | 1,129 | 4,605 | 3,976 | 1,615 | ||||
| 1990's | 1,742 | 1,099 | 525 | 536 | 389 | 219 | 116 | 650 | 719 | 420 |
| 2000's | 498 | 620 | 326 | 294 | 466 | 664 | 431 | 464 | 376 | 361 |
| 2010's | 509 | 270 | 294 | 215 | 154 | 62 | 207 | 158 | 52 | 136 |
| 2020's | 368 |
| - = No Data Reported; -- = Not Applicable; NA = Not Available; W = Withheld to avoid disclosure of individual company data. |
| Release Date: 2/9/2022 |
| Next Release Date: Suspended |