|
Download Data (XLS File) |
|
|||||
|
|||||
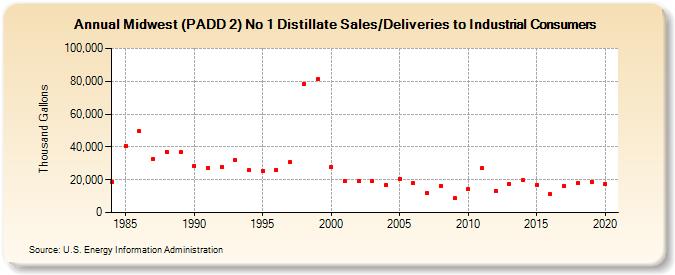
| Midwest (PADD 2) No 1 Distillate Sales/Deliveries to Industrial Consumers (Thousand Gallons) | |||||
| Decade | Year-0 | Year-1 | Year-2 | Year-3 | Year-4 | Year-5 | Year-6 | Year-7 | Year-8 | Year-9 |
|---|---|---|---|---|---|---|---|---|---|---|
| 1980's | 18,745 | 40,743 | 49,395 | 32,715 | 37,107 | 36,594 | ||||
| 1990's | 28,412 | 27,420 | 28,007 | 31,941 | 25,727 | 25,450 | 26,143 | 30,578 | 78,028 | 81,057 |
| 2000's | 27,711 | 19,344 | 18,958 | 19,053 | 16,981 | 20,688 | 17,791 | 11,726 | 16,328 | 8,647 |
| 2010's | 14,181 | 27,083 | 13,238 | 17,580 | 19,665 | 16,874 | 11,102 | 16,105 | 17,803 | 18,723 |
| 2020's | 17,434 |
| - = No Data Reported; -- = Not Applicable; NA = Not Available; W = Withheld to avoid disclosure of individual company data. |
| Release Date: 2/9/2022 |
| Next Release Date: Suspended |