|
Download Data (XLS File) |
|
|||||
|
|||||
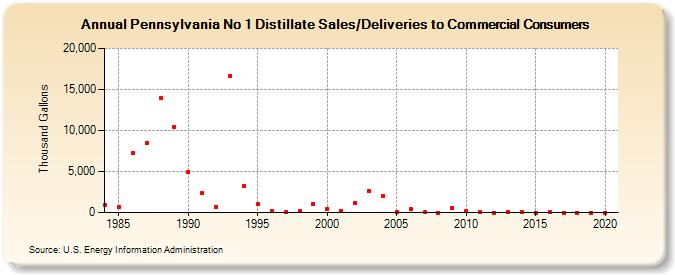
| Pennsylvania No 1 Distillate Sales/Deliveries to Commercial Consumers (Thousand Gallons) | |||||
| Decade | Year-0 | Year-1 | Year-2 | Year-3 | Year-4 | Year-5 | Year-6 | Year-7 | Year-8 | Year-9 |
|---|---|---|---|---|---|---|---|---|---|---|
| 1980's | 970 | 704 | 7,285 | 8,484 | 13,962 | 10,478 | ||||
| 1990's | 4,990 | 2,410 | 669 | 16,599 | 3,230 | 994 | 201 | 57 | 211 | 1,048 |
| 2000's | 482 | 185 | 1,170 | 2,681 | 2,057 | 69 | 416 | 14 | 1 | 595 |
| 2010's | 170 | 11 | 6 | 11 | 8 | 7 | 25 | 7 | 0 | 1 |
| 2020's | 0 |
| - = No Data Reported; -- = Not Applicable; NA = Not Available; W = Withheld to avoid disclosure of individual company data. |
| Release Date: 2/9/2022 |
| Next Release Date: Suspended |