|
Download Data (XLS File) |
|
|||||
|
|||||
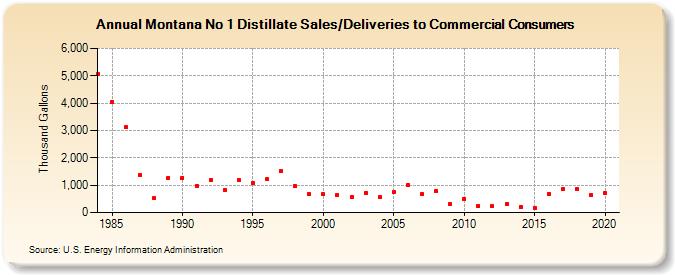
| Montana No 1 Distillate Sales/Deliveries to Commercial Consumers (Thousand Gallons) | |||||
| Decade | Year-0 | Year-1 | Year-2 | Year-3 | Year-4 | Year-5 | Year-6 | Year-7 | Year-8 | Year-9 |
|---|---|---|---|---|---|---|---|---|---|---|
| 1980's | 5,057 | 4,036 | 3,111 | 1,371 | 521 | 1,272 | ||||
| 1990's | 1,275 | 975 | 1,194 | 829 | 1,172 | 1,067 | 1,215 | 1,524 | 955 | 668 |
| 2000's | 671 | 646 | 551 | 729 | 553 | 752 | 1,014 | 683 | 778 | 297 |
| 2010's | 505 | 242 | 222 | 310 | 211 | 184 | 680 | 866 | 867 | 632 |
| 2020's | 705 |
| - = No Data Reported; -- = Not Applicable; NA = Not Available; W = Withheld to avoid disclosure of individual company data. |
| Release Date: 2/9/2022 |
| Next Release Date: Suspended |