|
Download Data (XLS File) |
|
|||||
|
|||||
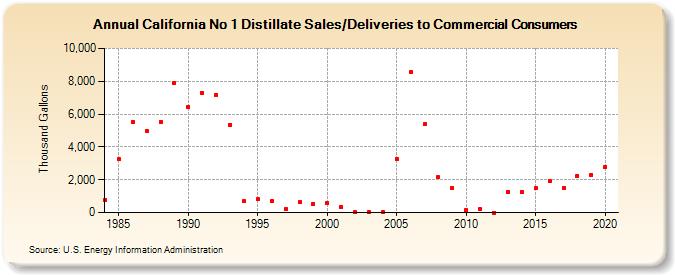
| California No 1 Distillate Sales/Deliveries to Commercial Consumers (Thousand Gallons) | |||||
| Decade | Year-0 | Year-1 | Year-2 | Year-3 | Year-4 | Year-5 | Year-6 | Year-7 | Year-8 | Year-9 |
|---|---|---|---|---|---|---|---|---|---|---|
| 1980's | 774 | 3,233 | 5,515 | 4,995 | 5,541 | 7,916 | ||||
| 1990's | 6,418 | 7,299 | 7,186 | 5,357 | 688 | 808 | 691 | 211 | 623 | 543 |
| 2000's | 576 | 369 | 24 | 22 | 8 | 3,269 | 8,554 | 5,368 | 2,138 | 1,467 |
| 2010's | 163 | 197 | 0 | 1,270 | 1,276 | 1,477 | 1,910 | 1,506 | 2,256 | 2,311 |
| 2020's | 2,804 |
| - = No Data Reported; -- = Not Applicable; NA = Not Available; W = Withheld to avoid disclosure of individual company data. |
| Release Date: 2/9/2022 |
| Next Release Date: Suspended |