|
Download Data (XLS File) |
|
|||||
|
|||||
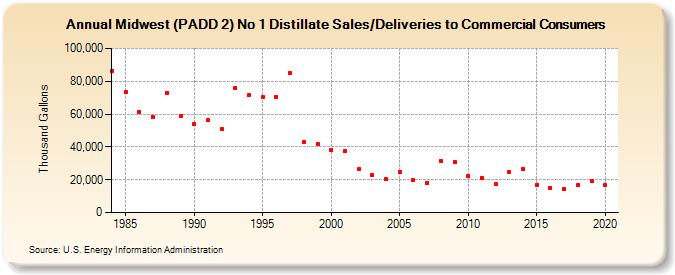
| Midwest (PADD 2) No 1 Distillate Sales/Deliveries to Commercial Consumers (Thousand Gallons) | |||||
| Decade | Year-0 | Year-1 | Year-2 | Year-3 | Year-4 | Year-5 | Year-6 | Year-7 | Year-8 | Year-9 |
|---|---|---|---|---|---|---|---|---|---|---|
| 1980's | 86,357 | 73,619 | 61,475 | 58,068 | 72,611 | 58,670 | ||||
| 1990's | 53,956 | 56,085 | 50,939 | 75,602 | 71,431 | 70,220 | 70,558 | 84,888 | 42,823 | 41,997 |
| 2000's | 38,132 | 37,278 | 26,294 | 22,866 | 20,577 | 24,991 | 19,606 | 18,278 | 31,686 | 30,719 |
| 2010's | 22,362 | 21,308 | 17,263 | 24,498 | 26,654 | 16,682 | 15,080 | 14,313 | 16,509 | 19,126 |
| 2020's | 16,512 |
| - = No Data Reported; -- = Not Applicable; NA = Not Available; W = Withheld to avoid disclosure of individual company data. |
| Release Date: 2/9/2022 |
| Next Release Date: Suspended |