|
Download Data (XLS File) |
|
|||||
|
|||||
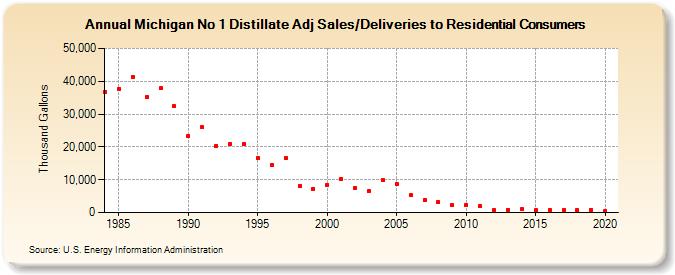
| Michigan No 1 Distillate Adj Sales/Deliveries to Residential Consumers (Thousand Gallons) | |||||
| Decade | Year-0 | Year-1 | Year-2 | Year-3 | Year-4 | Year-5 | Year-6 | Year-7 | Year-8 | Year-9 |
|---|---|---|---|---|---|---|---|---|---|---|
| 1980's | 36,753 | 37,688 | 41,341 | 35,084 | 37,792 | 32,313 | ||||
| 1990's | 23,442 | 25,920 | 20,401 | 20,938 | 20,819 | 16,626 | 14,521 | 16,673 | 8,212 | 7,271 |
| 2000's | 8,458 | 10,373 | 7,484 | 6,553 | 9,823 | 8,684 | 5,341 | 3,792 | 3,174 | 2,224 |
| 2010's | 2,277 | 1,867 | 766 | 932 | 964 | 694 | 804 | 809 | 634 | 823 |
| 2020's | 513 |
| - = No Data Reported; -- = Not Applicable; NA = Not Available; W = Withheld to avoid disclosure of individual company data. |
| Release Date: 2/9/2022 |
| Next Release Date: Suspended |