|
Download Data (XLS File) |
|
|||||
|
|||||
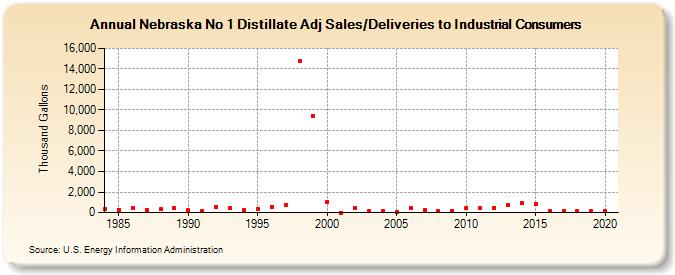
| Nebraska No 1 Distillate Adj Sales/Deliveries to Industrial Consumers (Thousand Gallons) | |||||
| Decade | Year-0 | Year-1 | Year-2 | Year-3 | Year-4 | Year-5 | Year-6 | Year-7 | Year-8 | Year-9 |
|---|---|---|---|---|---|---|---|---|---|---|
| 1980's | 334 | 276 | 489 | 230 | 310 | 418 | ||||
| 1990's | 218 | 148 | 554 | 404 | 226 | 383 | 554 | 728 | 14,727 | 9,433 |
| 2000's | 1,046 | 0 | 409 | 135 | 147 | 96 | 413 | 219 | 160 | 176 |
| 2010's | 468 | 433 | 487 | 720 | 916 | 881 | 138 | 127 | 123 | 142 |
| 2020's | 154 |
| - = No Data Reported; -- = Not Applicable; NA = Not Available; W = Withheld to avoid disclosure of individual company data. |
| Release Date: 2/9/2022 |
| Next Release Date: Suspended |