|
Download Data (XLS File) |
|
|||||
|
|||||
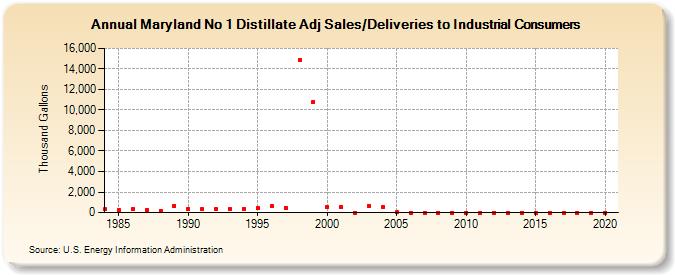
| Maryland No 1 Distillate Adj Sales/Deliveries to Industrial Consumers (Thousand Gallons) | |||||
| Decade | Year-0 | Year-1 | Year-2 | Year-3 | Year-4 | Year-5 | Year-6 | Year-7 | Year-8 | Year-9 |
|---|---|---|---|---|---|---|---|---|---|---|
| 1980's | 309 | 235 | 328 | 236 | 174 | 665 | ||||
| 1990's | 351 | 319 | 311 | 361 | 395 | 456 | 596 | 493 | 14,862 | 10,770 |
| 2000's | 575 | 548 | 0 | 666 | 575 | 15 | 1 | 0 | 0 | 0 |
| 2010's | 0 | 0 | 0 | 0 | 0 | 0 | 0 | 0 | 0 | 0 |
| 2020's | 0 |
| - = No Data Reported; -- = Not Applicable; NA = Not Available; W = Withheld to avoid disclosure of individual company data. |
| Release Date: 2/9/2022 |
| Next Release Date: Suspended |