|
Download Data (XLS File) |
|
|||||
|
|||||
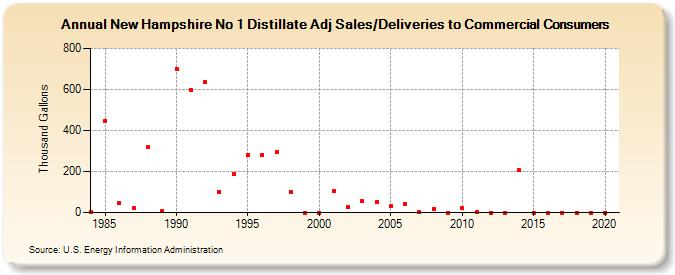
| New Hampshire No 1 Distillate Adj Sales/Deliveries to Commercial Consumers (Thousand Gallons) | |||||
| Decade | Year-0 | Year-1 | Year-2 | Year-3 | Year-4 | Year-5 | Year-6 | Year-7 | Year-8 | Year-9 |
|---|---|---|---|---|---|---|---|---|---|---|
| 1980's | 4 | 448 | 46 | 20 | 318 | 9 | ||||
| 1990's | 700 | 596 | 634 | 102 | 187 | 280 | 281 | 294 | 102 | 0 |
| 2000's | 0 | 104 | 25 | 54 | 51 | 30 | 41 | 4 | 19 | 0 |
| 2010's | 23 | 4 | 0 | 0 | 205 | 0 | 0 | 0 | 0 | 0 |
| 2020's | 0 |
| - = No Data Reported; -- = Not Applicable; NA = Not Available; W = Withheld to avoid disclosure of individual company data. |
| Release Date: 2/9/2022 |
| Next Release Date: Suspended |