|
Download Data (XLS File) |
|
|||||
|
|||||
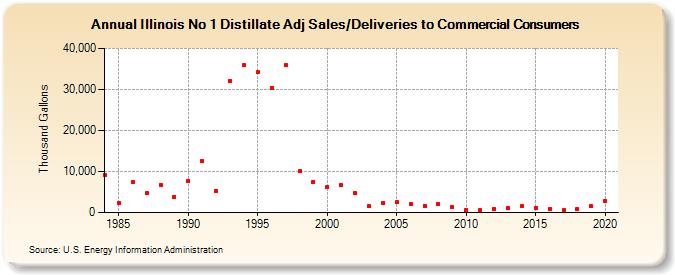
| Illinois No 1 Distillate Adj Sales/Deliveries to Commercial Consumers (Thousand Gallons) | |||||
| Decade | Year-0 | Year-1 | Year-2 | Year-3 | Year-4 | Year-5 | Year-6 | Year-7 | Year-8 | Year-9 |
|---|---|---|---|---|---|---|---|---|---|---|
| 1980's | 9,263 | 2,302 | 7,351 | 4,717 | 6,794 | 3,815 | ||||
| 1990's | 7,691 | 12,625 | 5,230 | 32,123 | 35,881 | 34,156 | 30,362 | 35,956 | 10,131 | 7,457 |
| 2000's | 6,300 | 6,632 | 4,787 | 1,513 | 2,419 | 2,499 | 2,025 | 1,706 | 2,136 | 1,289 |
| 2010's | 728 | 530 | 906 | 1,038 | 1,495 | 1,144 | 939 | 615 | 929 | 1,525 |
| 2020's | 2,909 |
| - = No Data Reported; -- = Not Applicable; NA = Not Available; W = Withheld to avoid disclosure of individual company data. |
| Release Date: 2/9/2022 |
| Next Release Date: Suspended |