|
Download Data (XLS File) |
|
|||||
|
|||||
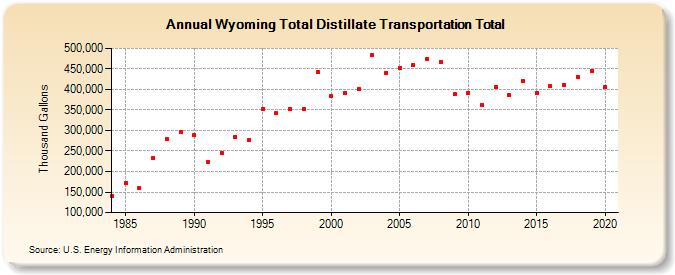
| Wyoming Total Distillate Transportation Total (Thousand Gallons) | |||||
| Decade | Year-0 | Year-1 | Year-2 | Year-3 | Year-4 | Year-5 | Year-6 | Year-7 | Year-8 | Year-9 |
|---|---|---|---|---|---|---|---|---|---|---|
| 1980's | 141,258 | 171,494 | 158,632 | 233,456 | 278,254 | 296,643 | ||||
| 1990's | 288,915 | 224,031 | 245,459 | 284,471 | 276,481 | 352,643 | 342,039 | 353,502 | 351,751 | 442,044 |
| 2000's | 384,132 | 390,780 | 401,172 | 482,729 | 440,802 | 452,256 | 460,083 | 475,098 | 467,932 | 388,162 |
| 2010's | 392,428 | 363,025 | 405,394 | 387,338 | 421,351 | 391,643 | 408,330 | 411,475 | 429,844 | 445,762 |
| 2020's | 405,446 |
| - = No Data Reported; -- = Not Applicable; NA = Not Available; W = Withheld to avoid disclosure of individual company data. |
| Release Date: 2/9/2022 |
| Next Release Date: Suspended |