|
Download Data (XLS File) |
|
|||||
|
|||||
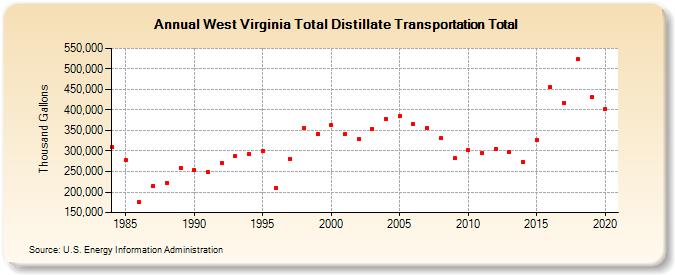
| West Virginia Total Distillate Transportation Total (Thousand Gallons) | |||||
| Decade | Year-0 | Year-1 | Year-2 | Year-3 | Year-4 | Year-5 | Year-6 | Year-7 | Year-8 | Year-9 |
|---|---|---|---|---|---|---|---|---|---|---|
| 1980's | 309,768 | 277,594 | 174,612 | 214,239 | 223,105 | 259,093 | ||||
| 1990's | 253,324 | 247,971 | 271,264 | 287,170 | 292,958 | 299,081 | 209,788 | 281,550 | 355,154 | 340,901 |
| 2000's | 363,428 | 342,256 | 329,645 | 354,477 | 378,120 | 384,956 | 365,564 | 355,449 | 330,717 | 282,020 |
| 2010's | 302,331 | 294,249 | 305,086 | 297,090 | 273,809 | 326,439 | 456,042 | 417,919 | 523,261 | 430,716 |
| 2020's | 401,349 |
| - = No Data Reported; -- = Not Applicable; NA = Not Available; W = Withheld to avoid disclosure of individual company data. |
| Release Date: 2/9/2022 |
| Next Release Date: Suspended |