|
Download Data (XLS File) |
|
|||||
|
|||||
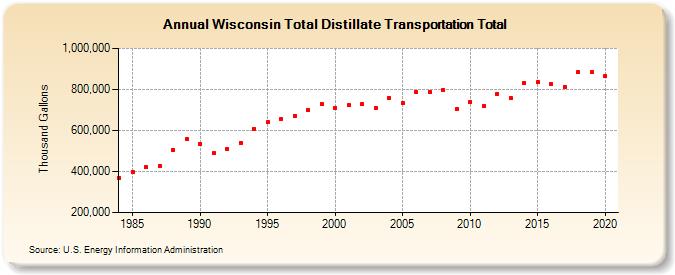
| Wisconsin Total Distillate Transportation Total (Thousand Gallons) | |||||
| Decade | Year-0 | Year-1 | Year-2 | Year-3 | Year-4 | Year-5 | Year-6 | Year-7 | Year-8 | Year-9 |
|---|---|---|---|---|---|---|---|---|---|---|
| 1980's | 370,601 | 398,805 | 421,148 | 428,373 | 504,903 | 558,926 | ||||
| 1990's | 536,019 | 489,661 | 510,667 | 540,404 | 608,776 | 639,360 | 656,578 | 672,230 | 699,598 | 730,246 |
| 2000's | 709,837 | 722,386 | 729,305 | 711,552 | 759,161 | 733,159 | 785,988 | 788,665 | 798,348 | 703,583 |
| 2010's | 738,953 | 719,417 | 780,145 | 757,734 | 833,311 | 835,281 | 825,788 | 813,694 | 883,929 | 882,605 |
| 2020's | 865,434 |
| - = No Data Reported; -- = Not Applicable; NA = Not Available; W = Withheld to avoid disclosure of individual company data. |
| Release Date: 2/9/2022 |
| Next Release Date: Suspended |