|
Download Data (XLS File) |
|
|||||
|
|||||
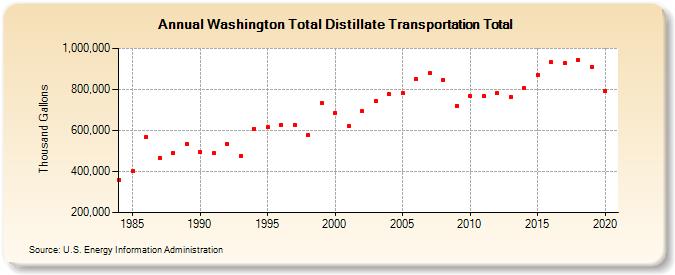
| Washington Total Distillate Transportation Total (Thousand Gallons) | |||||
| Decade | Year-0 | Year-1 | Year-2 | Year-3 | Year-4 | Year-5 | Year-6 | Year-7 | Year-8 | Year-9 |
|---|---|---|---|---|---|---|---|---|---|---|
| 1980's | 360,934 | 400,231 | 567,862 | 467,501 | 490,533 | 534,665 | ||||
| 1990's | 494,382 | 487,901 | 536,093 | 475,389 | 609,305 | 614,563 | 627,490 | 627,892 | 576,146 | 732,812 |
| 2000's | 686,961 | 619,919 | 692,973 | 743,687 | 775,982 | 783,542 | 850,435 | 877,916 | 847,918 | 720,872 |
| 2010's | 768,713 | 767,597 | 781,871 | 763,684 | 804,935 | 871,603 | 933,025 | 927,099 | 945,108 | 911,599 |
| 2020's | 792,186 |
| - = No Data Reported; -- = Not Applicable; NA = Not Available; W = Withheld to avoid disclosure of individual company data. |
| Release Date: 2/9/2022 |
| Next Release Date: Suspended |