|
Download Data (XLS File) |
|
|||||
|
|||||
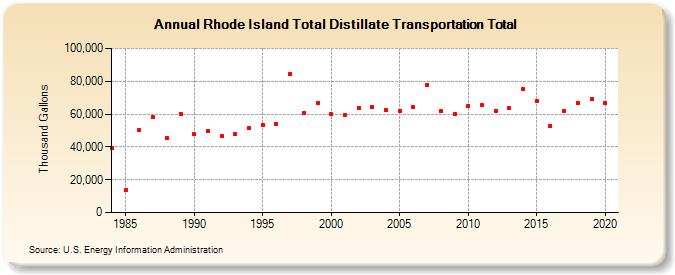
| Rhode Island Total Distillate Transportation Total (Thousand Gallons) | |||||
| Decade | Year-0 | Year-1 | Year-2 | Year-3 | Year-4 | Year-5 | Year-6 | Year-7 | Year-8 | Year-9 |
|---|---|---|---|---|---|---|---|---|---|---|
| 1980's | 39,302 | 13,736 | 50,106 | 57,982 | 45,410 | 60,240 | ||||
| 1990's | 47,657 | 49,493 | 46,747 | 47,845 | 51,556 | 53,414 | 54,144 | 84,361 | 60,624 | 66,984 |
| 2000's | 59,942 | 59,410 | 63,787 | 64,183 | 62,459 | 62,063 | 64,143 | 77,882 | 61,856 | 59,789 |
| 2010's | 65,067 | 65,295 | 62,041 | 63,408 | 75,109 | 67,822 | 52,967 | 61,857 | 67,029 | 68,982 |
| 2020's | 66,574 |
| - = No Data Reported; -- = Not Applicable; NA = Not Available; W = Withheld to avoid disclosure of individual company data. |
| Release Date: 2/9/2022 |
| Next Release Date: Suspended |