|
Download Data (XLS File) |
|
|||||
|
|||||
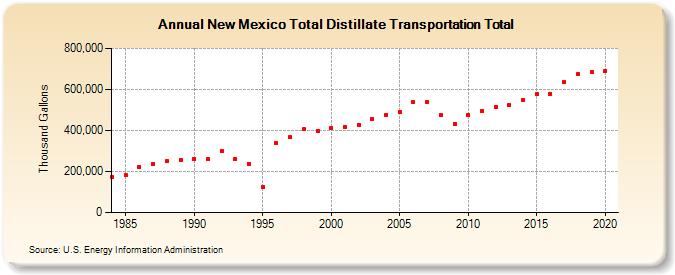
| New Mexico Total Distillate Transportation Total (Thousand Gallons) | |||||
| Decade | Year-0 | Year-1 | Year-2 | Year-3 | Year-4 | Year-5 | Year-6 | Year-7 | Year-8 | Year-9 |
|---|---|---|---|---|---|---|---|---|---|---|
| 1980's | 173,872 | 181,179 | 223,096 | 234,295 | 249,045 | 257,700 | ||||
| 1990's | 259,813 | 260,528 | 300,320 | 258,740 | 237,930 | 125,318 | 337,032 | 367,723 | 406,984 | 398,815 |
| 2000's | 409,827 | 418,486 | 428,835 | 454,706 | 477,438 | 492,311 | 536,579 | 537,165 | 475,919 | 433,039 |
| 2010's | 474,704 | 497,307 | 514,149 | 522,937 | 550,061 | 577,768 | 579,245 | 634,701 | 674,006 | 684,440 |
| 2020's | 691,661 |
| - = No Data Reported; -- = Not Applicable; NA = Not Available; W = Withheld to avoid disclosure of individual company data. |
| Release Date: 2/9/2022 |
| Next Release Date: Suspended |