|
Download Data (XLS File) |
|
|||||
|
|||||
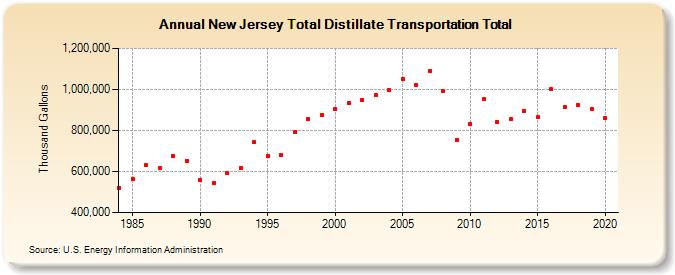
| New Jersey Total Distillate Transportation Total (Thousand Gallons) | |||||
| Decade | Year-0 | Year-1 | Year-2 | Year-3 | Year-4 | Year-5 | Year-6 | Year-7 | Year-8 | Year-9 |
|---|---|---|---|---|---|---|---|---|---|---|
| 1980's | 519,693 | 562,363 | 630,088 | 615,961 | 676,521 | 652,717 | ||||
| 1990's | 557,519 | 544,514 | 591,909 | 619,385 | 742,365 | 675,320 | 680,670 | 792,299 | 854,602 | 875,659 |
| 2000's | 902,331 | 934,419 | 950,220 | 971,864 | 999,284 | 1,052,948 | 1,021,645 | 1,091,896 | 991,981 | 755,753 |
| 2010's | 832,806 | 951,803 | 842,035 | 854,071 | 895,915 | 864,080 | 1,000,432 | 913,842 | 925,322 | 903,121 |
| 2020's | 859,538 |
| - = No Data Reported; -- = Not Applicable; NA = Not Available; W = Withheld to avoid disclosure of individual company data. |
| Release Date: 2/9/2022 |
| Next Release Date: Suspended |