|
Download Data (XLS File) |
|
|||||
|
|||||
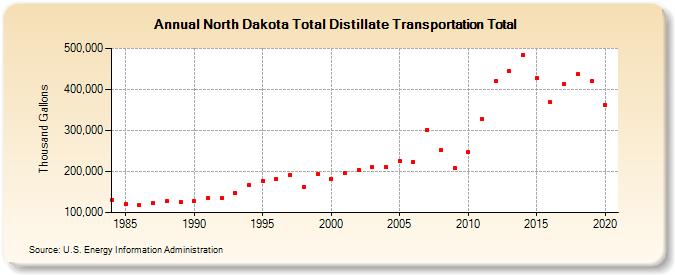
| North Dakota Total Distillate Transportation Total (Thousand Gallons) | |||||
| Decade | Year-0 | Year-1 | Year-2 | Year-3 | Year-4 | Year-5 | Year-6 | Year-7 | Year-8 | Year-9 |
|---|---|---|---|---|---|---|---|---|---|---|
| 1980's | 130,127 | 120,949 | 117,455 | 122,441 | 127,546 | 126,732 | ||||
| 1990's | 127,910 | 134,360 | 136,346 | 148,760 | 166,965 | 176,061 | 182,453 | 191,144 | 163,086 | 193,946 |
| 2000's | 182,429 | 196,790 | 204,047 | 209,942 | 210,576 | 225,409 | 223,449 | 302,299 | 252,282 | 207,626 |
| 2010's | 246,426 | 328,070 | 420,403 | 443,961 | 484,329 | 427,363 | 368,446 | 412,817 | 436,791 | 419,470 |
| 2020's | 362,262 |
| - = No Data Reported; -- = Not Applicable; NA = Not Available; W = Withheld to avoid disclosure of individual company data. |
| Release Date: 2/9/2022 |
| Next Release Date: Suspended |