|
Download Data (XLS File) |
|
|||||
|
|||||
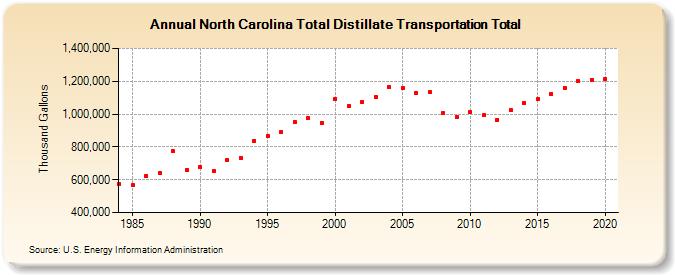
| North Carolina Total Distillate Transportation Total (Thousand Gallons) | |||||
| Decade | Year-0 | Year-1 | Year-2 | Year-3 | Year-4 | Year-5 | Year-6 | Year-7 | Year-8 | Year-9 |
|---|---|---|---|---|---|---|---|---|---|---|
| 1980's | 576,065 | 565,904 | 624,501 | 642,611 | 772,963 | 661,314 | ||||
| 1990's | 675,605 | 655,813 | 720,559 | 734,109 | 836,916 | 868,372 | 888,818 | 951,723 | 974,995 | 947,478 |
| 2000's | 1,092,525 | 1,050,275 | 1,075,351 | 1,104,535 | 1,164,320 | 1,158,681 | 1,130,049 | 1,132,585 | 1,005,821 | 982,729 |
| 2010's | 1,011,173 | 991,961 | 965,825 | 1,023,385 | 1,068,858 | 1,090,457 | 1,124,723 | 1,160,595 | 1,202,291 | 1,208,204 |
| 2020's | 1,214,757 |
| - = No Data Reported; -- = Not Applicable; NA = Not Available; W = Withheld to avoid disclosure of individual company data. |
| Release Date: 2/9/2022 |
| Next Release Date: Suspended |