|
Download Data (XLS File) |
|
|||||
|
|||||
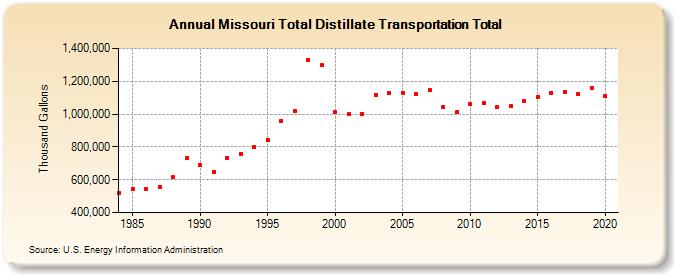
| Missouri Total Distillate Transportation Total (Thousand Gallons) | |||||
| Decade | Year-0 | Year-1 | Year-2 | Year-3 | Year-4 | Year-5 | Year-6 | Year-7 | Year-8 | Year-9 |
|---|---|---|---|---|---|---|---|---|---|---|
| 1980's | 522,045 | 544,656 | 545,007 | 556,507 | 618,075 | 729,317 | ||||
| 1990's | 690,189 | 649,295 | 730,322 | 757,693 | 799,792 | 845,021 | 957,364 | 1,019,309 | 1,326,976 | 1,295,797 |
| 2000's | 1,015,201 | 999,366 | 1,002,981 | 1,117,725 | 1,127,015 | 1,126,755 | 1,121,489 | 1,148,824 | 1,041,232 | 1,009,723 |
| 2010's | 1,063,428 | 1,064,504 | 1,043,396 | 1,046,400 | 1,077,000 | 1,104,816 | 1,130,450 | 1,135,716 | 1,124,578 | 1,157,836 |
| 2020's | 1,108,025 |
| - = No Data Reported; -- = Not Applicable; NA = Not Available; W = Withheld to avoid disclosure of individual company data. |
| Release Date: 2/9/2022 |
| Next Release Date: Suspended |