|
Download Data (XLS File) |
|
|||||
|
|||||
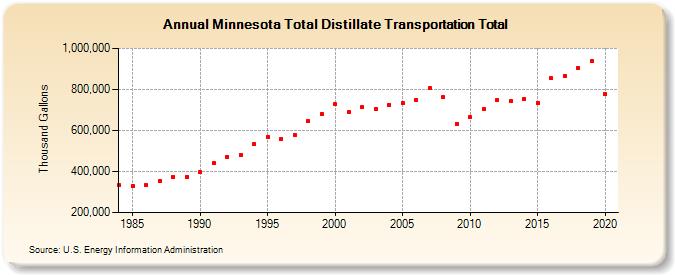
| Minnesota Total Distillate Transportation Total (Thousand Gallons) | |||||
| Decade | Year-0 | Year-1 | Year-2 | Year-3 | Year-4 | Year-5 | Year-6 | Year-7 | Year-8 | Year-9 |
|---|---|---|---|---|---|---|---|---|---|---|
| 1980's | 332,000 | 330,687 | 335,051 | 351,769 | 373,728 | 374,005 | ||||
| 1990's | 395,827 | 440,690 | 472,159 | 480,504 | 534,507 | 570,600 | 560,106 | 578,078 | 647,085 | 682,382 |
| 2000's | 727,613 | 687,967 | 712,318 | 706,769 | 725,499 | 734,705 | 748,683 | 804,699 | 761,187 | 633,806 |
| 2010's | 665,652 | 704,971 | 746,974 | 742,357 | 754,326 | 735,515 | 854,753 | 866,944 | 906,521 | 938,385 |
| 2020's | 777,065 |
| - = No Data Reported; -- = Not Applicable; NA = Not Available; W = Withheld to avoid disclosure of individual company data. |
| Release Date: 2/9/2022 |
| Next Release Date: Suspended |