|
Download Data (XLS File) |
|
|||||
|
|||||
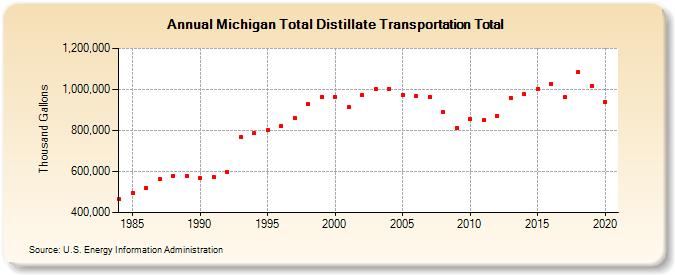
| Michigan Total Distillate Transportation Total (Thousand Gallons) | |||||
| Decade | Year-0 | Year-1 | Year-2 | Year-3 | Year-4 | Year-5 | Year-6 | Year-7 | Year-8 | Year-9 |
|---|---|---|---|---|---|---|---|---|---|---|
| 1980's | 464,057 | 497,686 | 520,681 | 562,223 | 578,436 | 576,773 | ||||
| 1990's | 570,425 | 570,911 | 598,720 | 766,619 | 785,634 | 800,113 | 821,623 | 861,754 | 928,401 | 964,751 |
| 2000's | 963,227 | 913,577 | 971,877 | 1,001,960 | 1,004,292 | 974,972 | 967,889 | 964,966 | 888,432 | 814,460 |
| 2010's | 855,592 | 850,681 | 871,756 | 960,471 | 976,373 | 1,004,065 | 1,027,858 | 961,870 | 1,084,782 | 1,018,519 |
| 2020's | 940,146 |
| - = No Data Reported; -- = Not Applicable; NA = Not Available; W = Withheld to avoid disclosure of individual company data. |
| Release Date: 2/9/2022 |
| Next Release Date: Suspended |