|
Download Data (XLS File) |
|
|||||
|
|||||
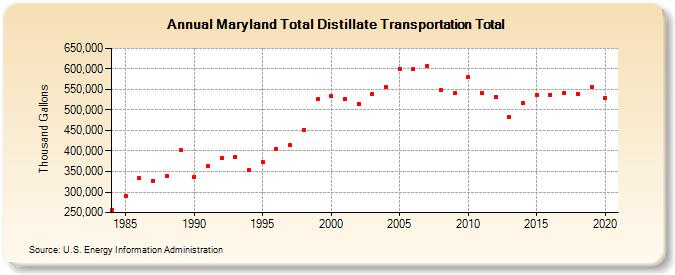
| Maryland Total Distillate Transportation Total (Thousand Gallons) | |||||
| Decade | Year-0 | Year-1 | Year-2 | Year-3 | Year-4 | Year-5 | Year-6 | Year-7 | Year-8 | Year-9 |
|---|---|---|---|---|---|---|---|---|---|---|
| 1980's | 256,304 | 291,298 | 333,359 | 327,133 | 339,596 | 401,890 | ||||
| 1990's | 337,784 | 363,235 | 382,996 | 385,630 | 352,809 | 372,656 | 404,990 | 413,838 | 452,078 | 526,259 |
| 2000's | 534,145 | 527,754 | 515,159 | 539,940 | 555,132 | 599,681 | 599,137 | 606,247 | 548,583 | 540,590 |
| 2010's | 579,203 | 540,843 | 531,683 | 483,340 | 517,766 | 537,516 | 537,140 | 542,180 | 539,568 | 554,953 |
| 2020's | 529,543 |
| - = No Data Reported; -- = Not Applicable; NA = Not Available; W = Withheld to avoid disclosure of individual company data. |
| Release Date: 2/9/2022 |
| Next Release Date: Suspended |