|
Download Data (XLS File) |
|
|||||
|
|||||
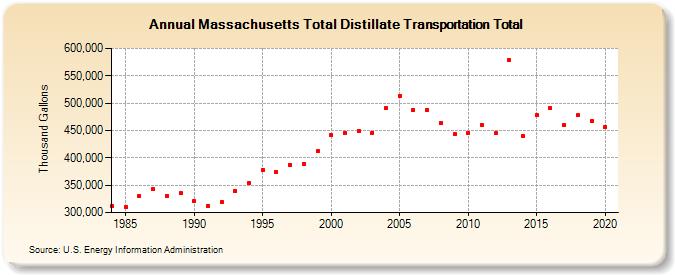
| Massachusetts Total Distillate Transportation Total (Thousand Gallons) | |||||
| Decade | Year-0 | Year-1 | Year-2 | Year-3 | Year-4 | Year-5 | Year-6 | Year-7 | Year-8 | Year-9 |
|---|---|---|---|---|---|---|---|---|---|---|
| 1980's | 311,154 | 310,061 | 331,132 | 342,524 | 330,700 | 335,496 | ||||
| 1990's | 320,704 | 312,278 | 319,984 | 338,958 | 354,323 | 378,259 | 373,554 | 387,448 | 389,642 | 412,007 |
| 2000's | 441,721 | 445,892 | 449,547 | 446,154 | 490,427 | 513,684 | 487,939 | 487,861 | 463,886 | 443,620 |
| 2010's | 445,626 | 460,154 | 444,532 | 578,580 | 440,803 | 477,662 | 490,891 | 459,705 | 477,642 | 467,755 |
| 2020's | 457,213 |
| - = No Data Reported; -- = Not Applicable; NA = Not Available; W = Withheld to avoid disclosure of individual company data. |
| Release Date: 2/9/2022 |
| Next Release Date: Suspended |