|
Download Data (XLS File) |
|
|||||
|
|||||
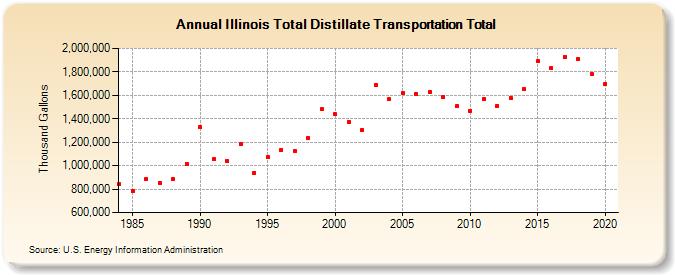
| Illinois Total Distillate Transportation Total (Thousand Gallons) | |||||
| Decade | Year-0 | Year-1 | Year-2 | Year-3 | Year-4 | Year-5 | Year-6 | Year-7 | Year-8 | Year-9 |
|---|---|---|---|---|---|---|---|---|---|---|
| 1980's | 842,492 | 784,477 | 883,159 | 852,645 | 884,511 | 1,018,084 | ||||
| 1990's | 1,328,606 | 1,052,536 | 1,040,669 | 1,184,168 | 939,344 | 1,072,477 | 1,137,432 | 1,126,366 | 1,233,057 | 1,479,483 |
| 2000's | 1,440,044 | 1,371,255 | 1,306,947 | 1,689,039 | 1,564,276 | 1,616,459 | 1,609,290 | 1,628,214 | 1,589,317 | 1,505,010 |
| 2010's | 1,469,087 | 1,569,074 | 1,510,830 | 1,576,455 | 1,652,870 | 1,891,869 | 1,828,786 | 1,927,303 | 1,909,546 | 1,781,621 |
| 2020's | 1,697,743 |
| - = No Data Reported; -- = Not Applicable; NA = Not Available; W = Withheld to avoid disclosure of individual company data. |
| Release Date: 2/9/2022 |
| Next Release Date: Suspended |