|
Download Data (XLS File) |
|
|||||
|
|||||
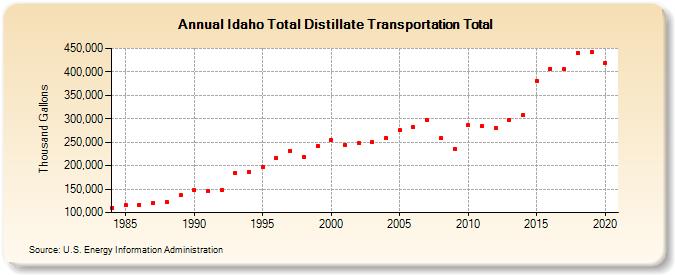
| Idaho Total Distillate Transportation Total (Thousand Gallons) | |||||
| Decade | Year-0 | Year-1 | Year-2 | Year-3 | Year-4 | Year-5 | Year-6 | Year-7 | Year-8 | Year-9 |
|---|---|---|---|---|---|---|---|---|---|---|
| 1980's | 110,752 | 115,175 | 116,731 | 121,095 | 122,288 | 136,900 | ||||
| 1990's | 147,218 | 146,217 | 148,953 | 184,730 | 187,235 | 197,358 | 217,170 | 231,980 | 219,008 | 242,588 |
| 2000's | 254,491 | 244,905 | 247,586 | 249,855 | 259,180 | 274,966 | 281,528 | 296,801 | 258,515 | 235,320 |
| 2010's | 285,729 | 284,455 | 280,897 | 298,104 | 306,945 | 381,173 | 406,766 | 405,240 | 440,899 | 442,915 |
| 2020's | 419,659 |
| - = No Data Reported; -- = Not Applicable; NA = Not Available; W = Withheld to avoid disclosure of individual company data. |
| Release Date: 2/9/2022 |
| Next Release Date: Suspended |