|
Download Data (XLS File) |
|
|||||
|
|||||
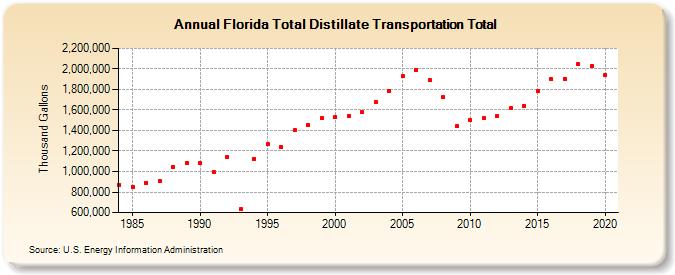
| Florida Total Distillate Transportation Total (Thousand Gallons) | |||||
| Decade | Year-0 | Year-1 | Year-2 | Year-3 | Year-4 | Year-5 | Year-6 | Year-7 | Year-8 | Year-9 |
|---|---|---|---|---|---|---|---|---|---|---|
| 1980's | 871,448 | 846,754 | 892,675 | 904,806 | 1,045,609 | 1,087,341 | ||||
| 1990's | 1,080,273 | 996,374 | 1,139,330 | 630,806 | 1,125,742 | 1,264,978 | 1,237,863 | 1,400,803 | 1,450,957 | 1,519,956 |
| 2000's | 1,530,934 | 1,542,572 | 1,575,700 | 1,673,871 | 1,788,826 | 1,928,188 | 1,993,714 | 1,890,213 | 1,723,991 | 1,441,072 |
| 2010's | 1,501,838 | 1,517,971 | 1,538,732 | 1,614,543 | 1,636,982 | 1,788,888 | 1,898,729 | 1,904,903 | 2,045,336 | 2,031,998 |
| 2020's | 1,936,590 |
| - = No Data Reported; -- = Not Applicable; NA = Not Available; W = Withheld to avoid disclosure of individual company data. |
| Release Date: 2/9/2022 |
| Next Release Date: Suspended |