|
Download Data (XLS File) |
|
|||||
|
|||||
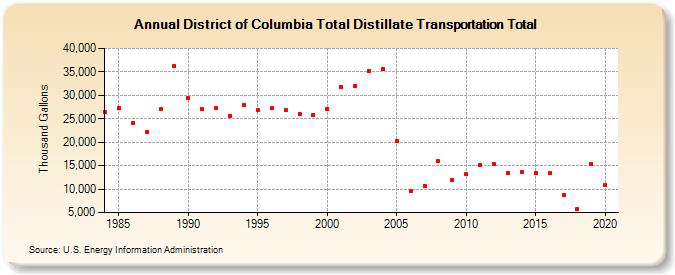
| District of Columbia Total Distillate Transportation Total (Thousand Gallons) | |||||
| Decade | Year-0 | Year-1 | Year-2 | Year-3 | Year-4 | Year-5 | Year-6 | Year-7 | Year-8 | Year-9 |
|---|---|---|---|---|---|---|---|---|---|---|
| 1980's | 26,536 | 27,201 | 24,063 | 22,219 | 26,989 | 36,280 | ||||
| 1990's | 29,325 | 27,074 | 27,234 | 25,688 | 27,926 | 26,969 | 27,234 | 26,794 | 26,087 | 25,892 |
| 2000's | 27,124 | 31,725 | 32,015 | 35,181 | 35,629 | 20,239 | 9,560 | 10,721 | 15,894 | 11,949 |
| 2010's | 13,216 | 15,149 | 15,321 | 13,529 | 13,635 | 13,455 | 13,368 | 8,744 | 5,663 | 15,340 |
| 2020's | 10,781 |
| - = No Data Reported; -- = Not Applicable; NA = Not Available; W = Withheld to avoid disclosure of individual company data. |
| Release Date: 2/9/2022 |
| Next Release Date: Suspended |