|
Download Data (XLS File) |
|
|||||
|
|||||
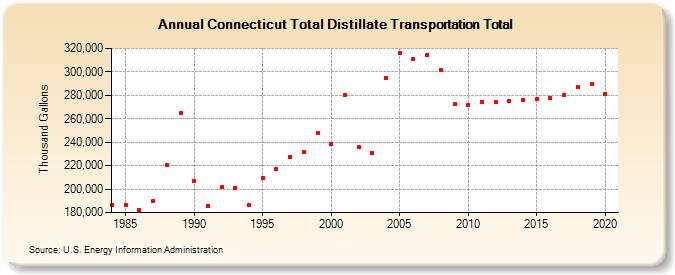
| Connecticut Total Distillate Transportation Total (Thousand Gallons) | |||||
| Decade | Year-0 | Year-1 | Year-2 | Year-3 | Year-4 | Year-5 | Year-6 | Year-7 | Year-8 | Year-9 |
|---|---|---|---|---|---|---|---|---|---|---|
| 1980's | 186,024 | 186,841 | 182,262 | 190,203 | 220,366 | 264,983 | ||||
| 1990's | 207,280 | 185,740 | 201,927 | 201,283 | 186,396 | 209,397 | 217,109 | 227,684 | 231,991 | 247,506 |
| 2000's | 238,303 | 280,607 | 235,793 | 231,171 | 295,174 | 316,075 | 311,156 | 314,674 | 301,591 | 272,255 |
| 2010's | 271,852 | 274,578 | 274,507 | 274,758 | 275,691 | 276,871 | 277,894 | 279,902 | 287,397 | 289,406 |
| 2020's | 281,525 |
| - = No Data Reported; -- = Not Applicable; NA = Not Available; W = Withheld to avoid disclosure of individual company data. |
| Release Date: 2/9/2022 |
| Next Release Date: Suspended |