|
Download Data (XLS File) |
|
|||||
|
|||||
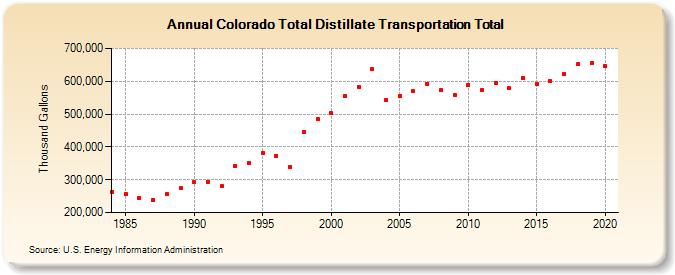
| Colorado Total Distillate Transportation Total (Thousand Gallons) | |||||
| Decade | Year-0 | Year-1 | Year-2 | Year-3 | Year-4 | Year-5 | Year-6 | Year-7 | Year-8 | Year-9 |
|---|---|---|---|---|---|---|---|---|---|---|
| 1980's | 263,446 | 256,166 | 244,725 | 238,757 | 255,498 | 273,551 | ||||
| 1990's | 291,971 | 293,956 | 281,776 | 342,255 | 350,874 | 381,498 | 373,531 | 339,474 | 445,970 | 484,991 |
| 2000's | 502,162 | 555,051 | 583,037 | 636,436 | 542,902 | 554,492 | 569,327 | 592,926 | 571,908 | 558,042 |
| 2010's | 589,567 | 572,728 | 594,585 | 577,894 | 611,221 | 592,101 | 600,237 | 622,428 | 651,559 | 654,971 |
| 2020's | 645,912 |
| - = No Data Reported; -- = Not Applicable; NA = Not Available; W = Withheld to avoid disclosure of individual company data. |
| Release Date: 2/9/2022 |
| Next Release Date: Suspended |