|
Download Data (XLS File) |
|
|||||
|
|||||
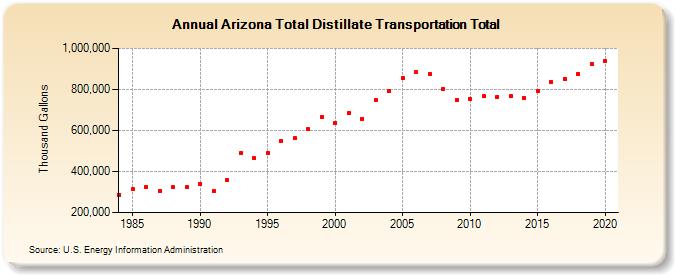
| Arizona Total Distillate Transportation Total (Thousand Gallons) | |||||
| Decade | Year-0 | Year-1 | Year-2 | Year-3 | Year-4 | Year-5 | Year-6 | Year-7 | Year-8 | Year-9 |
|---|---|---|---|---|---|---|---|---|---|---|
| 1980's | 286,927 | 313,302 | 325,856 | 302,927 | 322,569 | 322,959 | ||||
| 1990's | 341,118 | 305,099 | 358,671 | 489,891 | 464,231 | 487,821 | 547,405 | 561,127 | 605,710 | 664,708 |
| 2000's | 636,469 | 683,543 | 658,203 | 747,083 | 792,773 | 857,731 | 884,033 | 877,477 | 799,928 | 748,063 |
| 2010's | 752,154 | 767,489 | 763,303 | 766,493 | 759,392 | 791,371 | 836,885 | 852,535 | 876,698 | 923,418 |
| 2020's | 938,750 |
| - = No Data Reported; -- = Not Applicable; NA = Not Available; W = Withheld to avoid disclosure of individual company data. |
| Release Date: 2/9/2022 |
| Next Release Date: Suspended |